
Custom Dashboard
Build dashboard views around the Booking Ninjas data your team needs to monitor — from bookings and occupancy to revenue, memberships, requests, and operations.
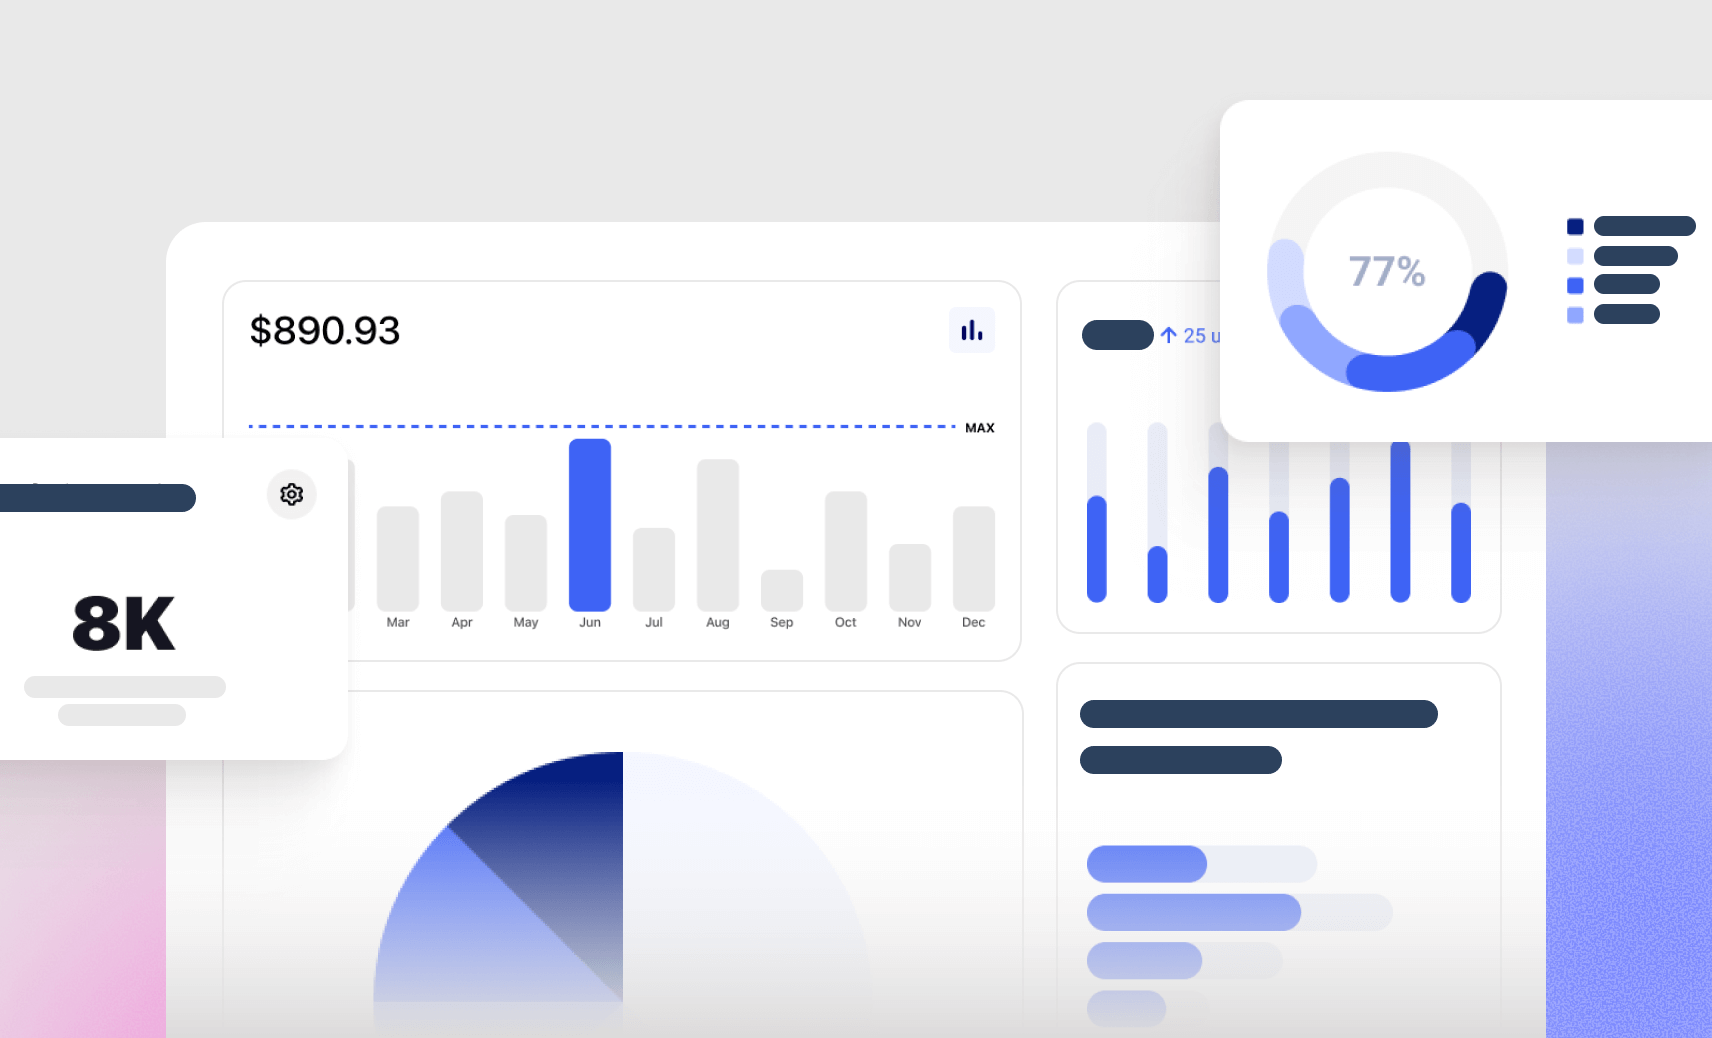
Build Views Around the Work
Choose the records, metrics, filters, and charts that help each team understand what is happening.

Role-Based Views
Create dashboards for leadership, operations, finance, sales, or other teams.
KPI Cards
Highlight the numbers that matter most for the selected workflow.
Charts & Tables
Visualise available data using practical reporting components.
Filters
Review data by date, property, location, status, category, or other available fields.
Use the Data Already Connected to Booking Ninjas
Dashboards can combine supported operational records without rebuilding the same information in separate spreadsheets.

Bookings & Availability
Review reservation volume, status, availability, occupancy, or other captured booking metrics.

Revenue & Billing
Bring invoice, payment, booking-value, and other available financial data into reporting views.
Customers & Memberships
Use customer, member, portal, and related activity data where those workflows are part of the implementation.
Operational Work
Monitor requests, maintenance, inspections, events, or other supported operational records.
Make Dashboards Easier to Use
Keep the reporting view focused on the questions each team actually needs to answer.
- Choose the metrics that belong on each dashboard
- Filter by available dimensions and date ranges
- Compare locations or business units where the data model supports it
- Use charts, tables, and summary metrics together
- Keep sensitive data limited by Salesforce permissions
- Save different views for different teams or processes
Works With the Insights Layer
Custom Dashboard works alongside KPI tracking, reporting, business intelligence, and customer insight.
KPI Dashboard
Build a focused view around selected operational or business KPIs.
View KPI Dashboard →KPI Tracking
Track defined metrics over time using available Booking Ninjas data.
View KPI Tracking →Performance Reporting
Turn operational data into recurring reports and review views.
View Performance Reporting →Business Intelligence
Extend reporting when the organisation needs a broader BI layer.
View Business Intelligence →CEO Dashboard
Give leadership a focused view of selected operational and business metrics.
View CEO Dashboard →Customer Intelligence
Bring customer and booking context into relevant dashboard views.
View Customer Intelligence →Where Custom Dashboards Fit
Use role-specific dashboards wherever teams need a clearer view of bookings, revenue, customers, spaces, or operational work.
Hotel
Combine reservation, occupancy, revenue, guest, and operational metrics.
View Hotel Solution →Coworking Space
Track memberships, room bookings, billing, and shared-space activity.
View Coworking Solution →Student Housing
Review resident, unit, billing, request, and occupancy data in one place.
View Student Housing Solution →Retreat Centre
Monitor stays, group bookings, spaces, payments, and operational activity.
View Retreat Centre Solution →Conference Centre
Bring room bookings, events, utilisation, customers, and revenue into focused views.
View Conference Centre Solution →Banquet Hall
Review event bookings, space use, billing, and operational status.
View Banquet Hall Solution →Dashboard Quality Depends on the Data Model
Booking Ninjas can support standard Salesforce reports and dashboards and can configure custom views around available records and fields. Advanced forecasting, predictive modelling, external data, specialised BI, or highly complex cross-system analytics may require additional Salesforce products, integrations, or implementation.
Verified in the Salesforce Ecosystem.
Booking Ninjas is listed on Salesforce AppExchange.
Pricing
Standard reports and dashboards are included in the Booking Ninjas Core foundation. Custom dashboard work is scoped around the reporting requirement.
Core Package
Starts with 1–50 Active Bookable Units.
- Standard reports and dashboards
- Booking and reservation data
- Contact and property data
- Invoicing and billing context
- Salesforce-native operational records
Dashboard Configuration
Scoped as neededCustom dashboard work depends on the metrics, fields, filters, layouts, source systems, permissions, and reporting logic required.
- No separate public Custom Dashboard SKU shown here
- Standard dashboard configuration can be handled during implementation
- External data sources may require integration
- Advanced BI or predictive analytics may require additional scope
Spreadsheet Reporting vs Booking Ninjas
Keep reporting closer to the same operational data your team already uses.
| Capability | Spreadsheet / Separate Reporting | Booking Ninjas |
|---|---|---|
| Data source | Manual exports | Connected Salesforce records |
| Dashboard views | Built separately | Configured around operational data |
| Filtering | Manual worksheet logic | Available Salesforce filters and fields |
| Permissions | File-level access | Salesforce permission model |
| Cross-team reporting | Manual consolidation | Shared reporting foundation |
| Advanced analytics | Separate project | Can be extended when needed |
Frequently Asked Questions

Build a Dashboard Around Your Operation
Bring the booking, revenue, customer, space, and operational metrics your team needs into a clearer Salesforce reporting view.