
Revenue Forecasting
Use historical bookings, revenue, occupancy, rates, and other available operational data to build clearer revenue forecasts and compare expectations with actual performance.
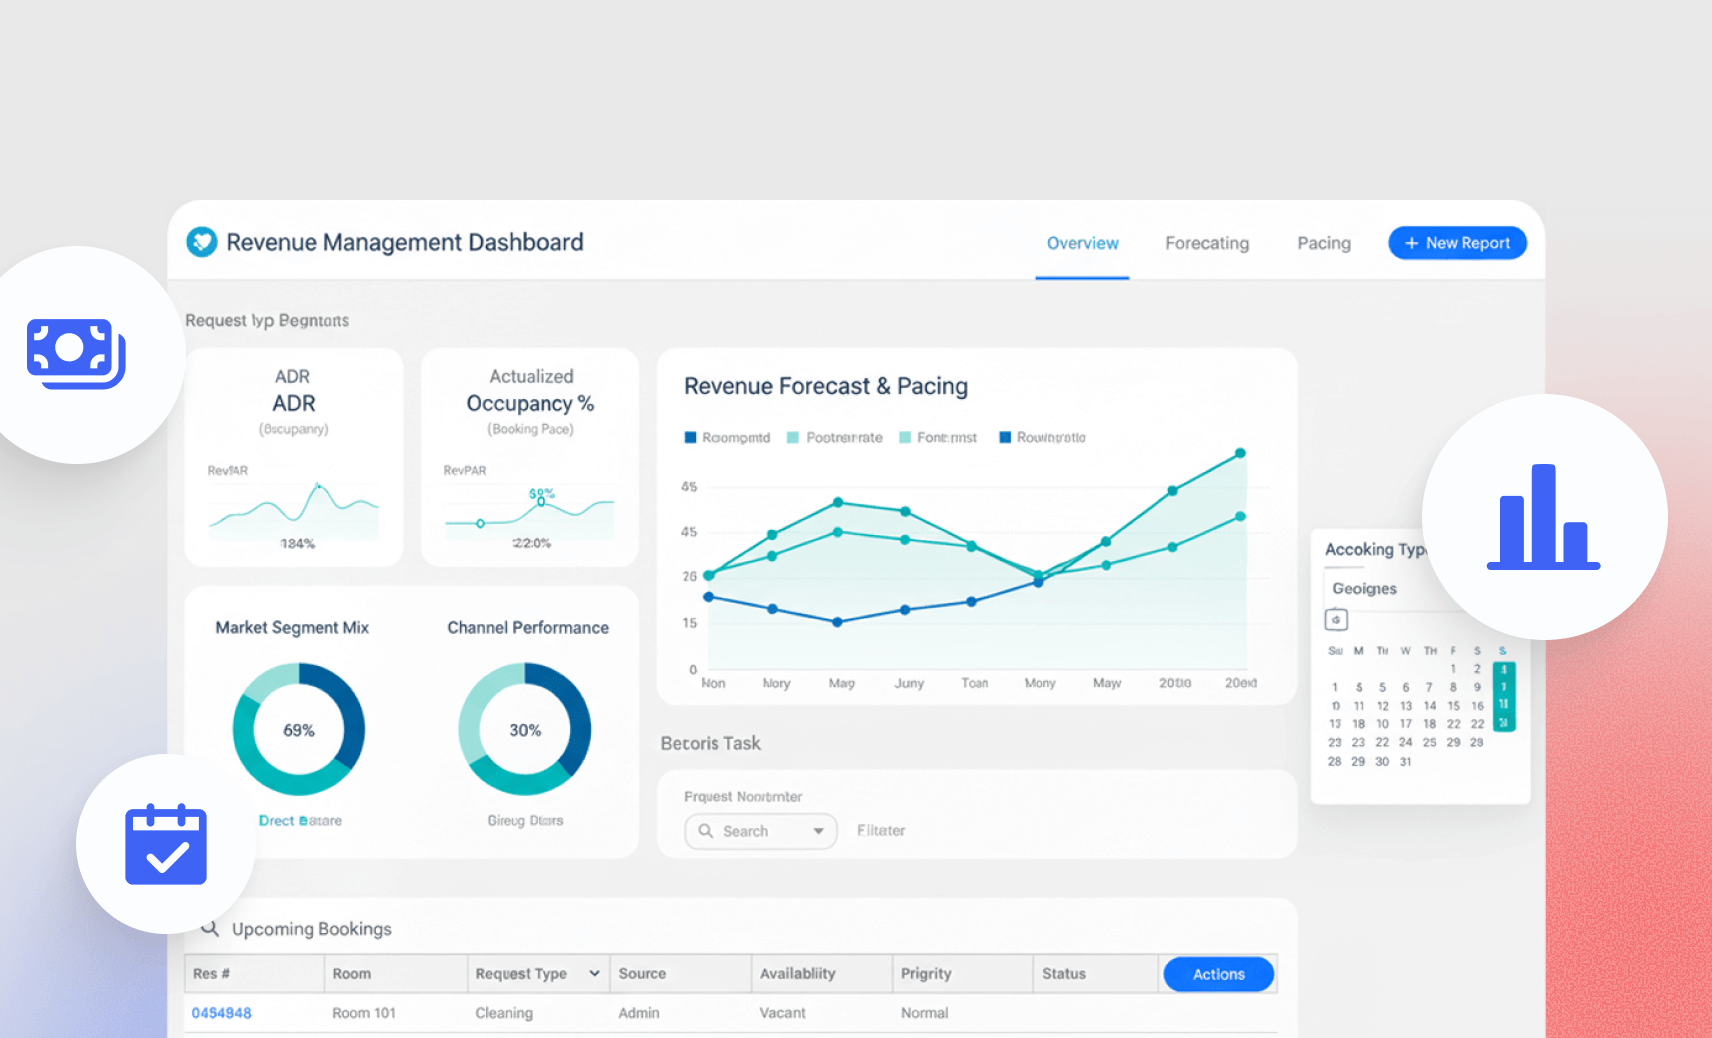
Start With the Revenue Data You Already Have
Bring booking, occupancy, rate, invoice, and payment history into a clearer forecasting view.

Historical Revenue
Use captured booking and billing history as the baseline for analysis.
Occupancy & Utilization
Include booked capacity, occupancy, or utilization where that data is available.
Rates & Booking Value
Review historical rates and booking value alongside volume and timing.
Seasonality
Compare historical periods to identify recurring high- and low-demand patterns.
Build Forecasts Around the Business
Forecasting can be configured around the time periods, locations, offerings, and revenue categories your team actually reviews.

By Period
Build monthly, quarterly, seasonal, or other forecast views around the reporting cycle.

By Location
Compare forecast inputs and outcomes across properties or locations where the data structure supports it.
By Offering
Separate rooms, spaces, services, events, memberships, or other revenue categories when they are tracked distinctly.
Forecast vs. Actual
Compare the forecast with actual captured revenue after the period closes.
Use Scenarios When Planning Changes
Scenario analysis can help teams test assumptions before changing rates, capacity, or operating plans.
- Different demand assumptions
- Alternative rate assumptions
- Capacity or utilization changes
- Seasonal planning scenarios
- Location-by-location comparisons
- Conservative, baseline, and growth cases
Works With the Revenue Insights Layer
Revenue Forecasting works best alongside the features that explain demand, pricing, revenue performance, and historical results.
Demand Forecasting
Use historical booking and demand patterns as part of the forecasting process.
View Demand Forecasting →Pricing Analytics
Review rate and booking-value patterns alongside forecast assumptions.
View Pricing Analytics →Revenue Intelligence
Bring revenue performance and related operational context into the same reporting layer.
View Revenue Intelligence →Performance Reporting
Compare forecast assumptions with historical and actual performance.
View Performance Reporting →A Forecast Is an Estimate, Not a Guaranteed Outcome
Booking Ninjas can support forecast models, dashboards, and comparisons using the operational data available. Forecast quality depends on historical volume, data consistency, seasonality, assumptions, rate changes, external conditions, and the modeling approach. Predictive models, external market data, and AI-assisted forecasting are not assumed by default and may require additional analytics, integration, or implementation.
Verified in the Salesforce Ecosystem.
Booking Ninjas is listed on Salesforce AppExchange.
Pricing
Revenue Forecasting starts with the booking, billing, and standard reporting data available in the Booking Ninjas Core foundation.
Core Package
Starts with 1–50 Active Bookable Units.
- Booking Engine + Reservation System
- Availability and Rate Management
- Invoicing and Billing
- Occupancy and booking data
- Standard reports and dashboards
Configured as Needed
Scoped to the use caseCustom forecasts depend on the historical data, forecast horizon, business rules, assumptions, external data, and reporting requirements.
- No separate public Revenue Forecasting SKU shown here
- Forecast views and assumptions can be configured
- External market data may require integration
- Predictive or AI-assisted models are scoped separately
Manual Forecasting vs Booking Ninjas
Keep forecast assumptions closer to the same booking and revenue records used by the operation.
| Capability | Spreadsheet Forecast | Booking Ninjas |
|---|---|---|
| Historical bookings | Imported manually | Connected reservation data |
| Revenue history | Manual roll-up | Connected billing context |
| Forecast assumptions | Separate spreadsheet logic | Can be configured around the data model |
| Forecast vs. actual | Manual comparison | Can use connected reporting data |
| Location comparison | Separate workbook tabs | Can use available location fields |
| Advanced forecasting | Separate analytics project | Can be scoped on the same data foundation |
Frequently Asked Questions

Build Revenue Forecasts From Connected Operational Data
Use booking, occupancy, rate, billing, and historical performance data to build clearer forecasts and compare them with actual results.