Custom Dashboards
Total data visibility and real-time control over every part of your operation. Build dashboards that adapt to your workflow and keep your entire property performance at a glance.
Design Dashboards for Every Role
Custom dashboard software ensures every user sees the metrics that matter—aligned to their role, responsibilities, and objectives.
Department-Specific Dashboards
Create dashboards tailored to finance, operations, sales, and leadership teams.
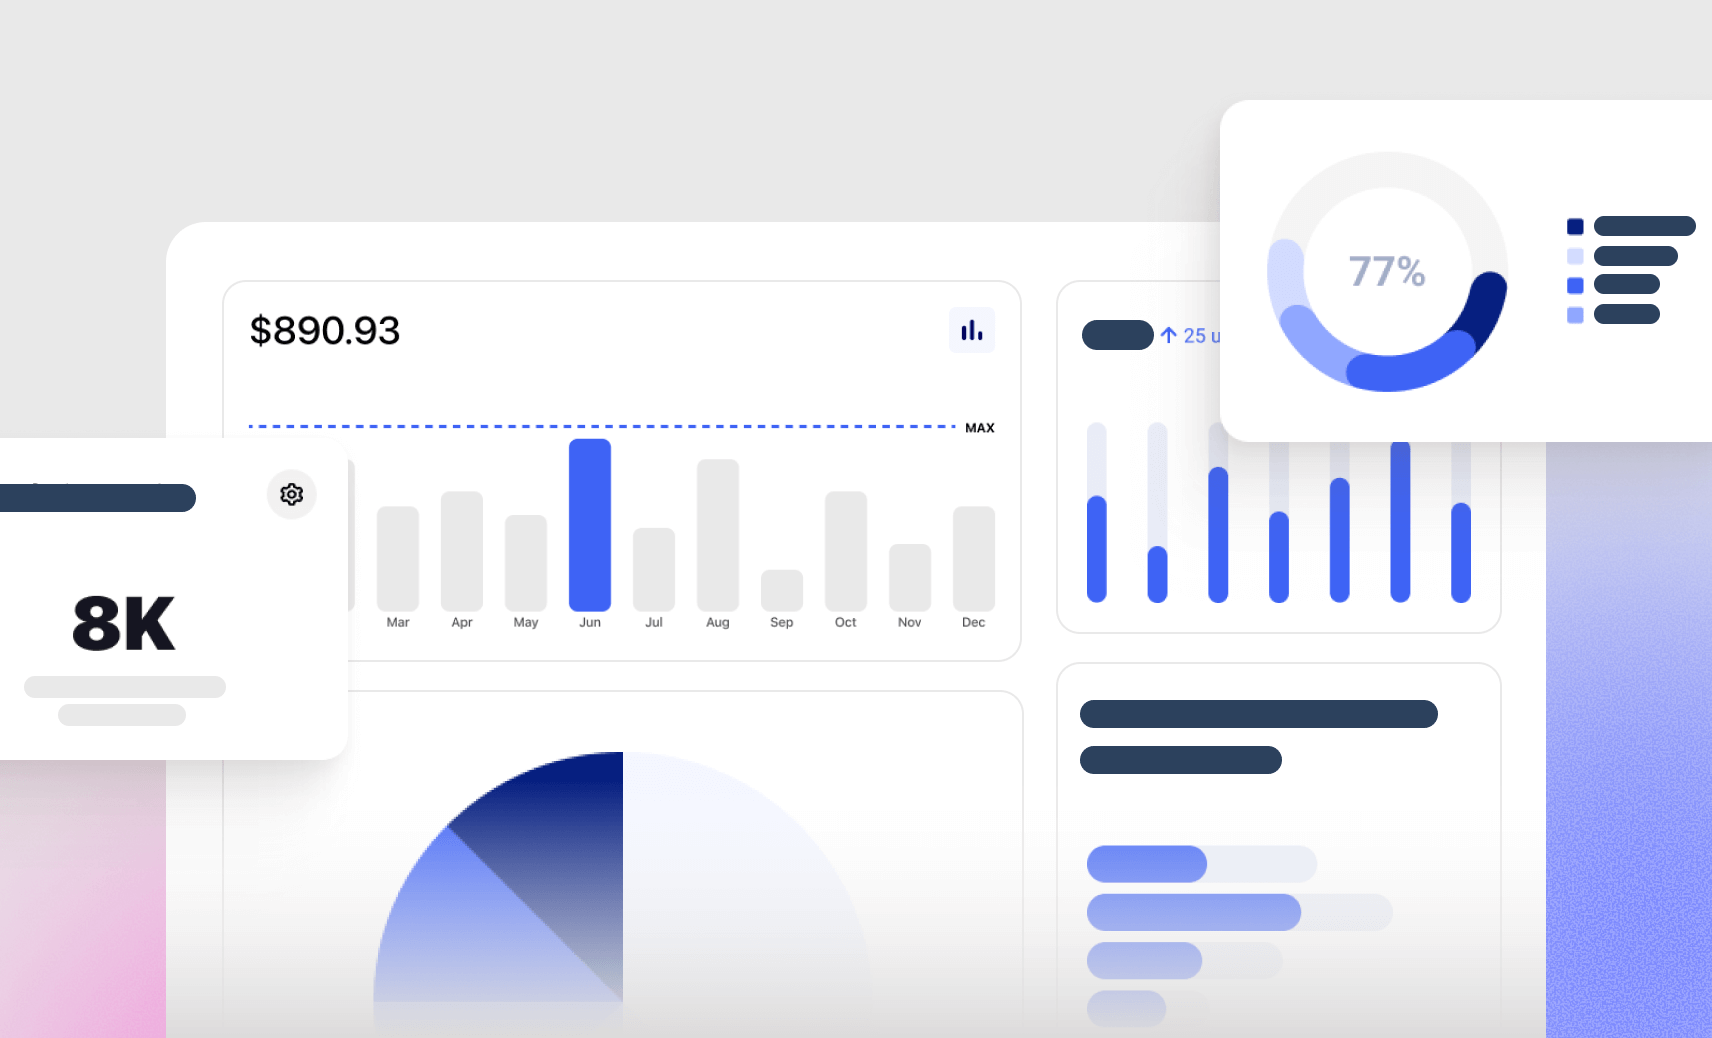
KPI Widgets and Visualizations
Configure charts, graphs, and KPI widgets to reflect real-time performance.
Executive and Operational Views
Build dashboards for strategic, operational, and financial oversight.
Role-Based Access Control
Ensure users only access dashboards and data relevant to their role.
Track KPIs in Real Time
Monitor performance as it happens. Real-time dashboards enable faster, data-driven decisions.
Revenue and Margin Tracking
Monitor revenue, cost, and profitability metrics across operations.
Operational KPI Monitoring
Track efficiency metrics across departments and workflows.
Forecast vs. Actual Analysis
Compare planned performance against real-time outcomes.
Cross-Location Insights
Analyze performance across properties, regions, or business units.
Enable Interactive Data Exploration
Go beyond static reports. Explore data dynamically with intuitive, interactive dashboards.
Drill-Down Analysis
Explore performance by segment, department, or individual data points.
Real-Time Filtering
Filter data dynamically to focus on relevant timeframes or metrics.
Trend Visualization
Visualize performance trends over time with structured charts.
Comparative Analysis
Compare performance across locations, teams, or time periods.
Align Dashboards With Strategic Goals
Dashboards should reflect what matters most. Align performance metrics with your strategic objectives.
- Link KPIs to strategic objectives
- Track goal achievement progress
- Monitor initiative performance
- Support executive-level reporting
- Maintain structured performance documentation
Manage Multi-Entity Dashboard Visibility
Consolidate insights across portfolios, properties, and business units with structured visibility.
- Cross-location dashboard comparisons
- Multi-entity reporting consolidation
- Portfolio-level KPI monitoring
- Departmental benchmarking
- Executive review workflows
Built Directly Into Salesforce
Dashboards operate inside your core system—no disconnected BI tools or manual reporting layers.
CRM and Financial Integration
Dashboards connect directly to CRM, bookings, and financial systems.
Real-Time KPI Updates
Metrics update instantly as data changes across the system.
Role-Based Governance
Ensure secure and structured access to dashboard data.
Forecasting Alignment
Connect reporting with planning, forecasting, and compliance workflows.
AI-Powered Dashboard Intelligence
Your dashboards evolve as your data grows—delivering predictive insights, not just reports.
AI-Driven Performance Insights
From visibility to intelligence.
KPI Deviation Detection
Automatically detect anomalies and performance gaps.
Trend Forecasting
Predict future performance based on historical data patterns.
Risk Identification
Highlight operational and financial risks proactively.
Opportunity Insights
Identify growth opportunities across departments and regions.
Performance Recommendations
Receive actionable insights to improve KPIs continuously.